5. Renesas Memory Usage View
Memory Usage is used to retrieve information from a project’s .map, .elf (Executable and Linkable Format), or .abs (Absolute) file. It provides an overview of:
Total memory size
ROM/RAM usage ratio
Detailed information on sections and symbols used in the project
It also uses the device’s memory configuration, linker script, and .map file from the project’s target device to extract:
Defined memory areas of the device
Size and used size of each memory area
Sections assigned to each memory area
5.1. Open Memory Usage View
Open the [Command Palette] (use [View] => [Command Palette] menu, or use [⌘ (Command) + ⇧ (Shift) + P] on macOS or [CTRL+SHIFT+P] on Windows and Linux ), then click [Renesas: Memory Usage View].
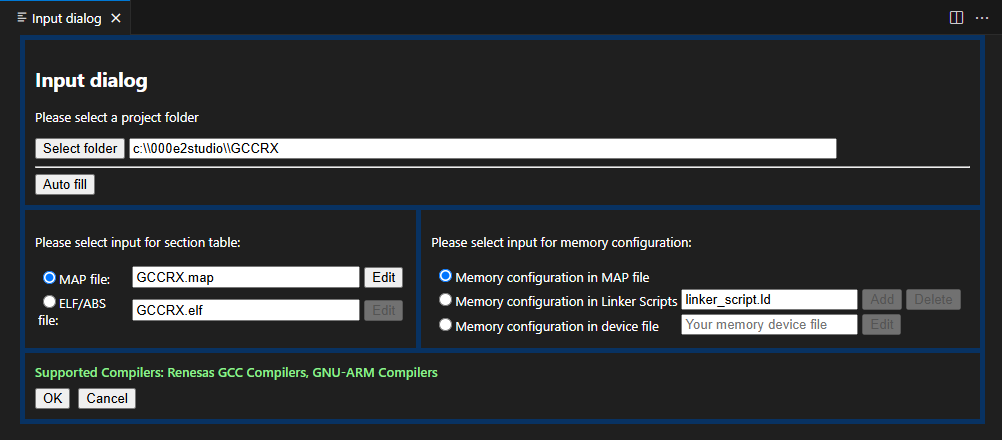
An Input Dialog will appear to be prepared for data entry.
5.1.1. Input Dialog
Step 1: Select Project Folder
Firstly, it is expected to select the target project folder. By default, the path shows the current workspace folder. You can change the target folder by using the “Select folder” button. When the “Select folder” button is clicked, a folder pick dialog will appear to select a different folder. After selecting a different folder, the configuration is updated automatically. You can use the “Auto fill” button to trigger the action if anything is out of date.
Step 2: Select input for section table
A .map file or load module (.abs or .elf) will be automatically detected or can also be selected manually.
Step 3: Select input for memory configuration
Memory configuration is used for reading information of memory areas such as name, address, size. The configuration will be selected automatically, however, it can also be changed between options manually.
The automatic selection is performed in the following order:
Memory configuration in the MAP file
Memory configuration in the Linker Scripts
Memory configuration in the Device File
Step 4: Error Handling and Final Actions
For each entry, a tooltip will display the valid toolchains.
When the user presses the OK button, the error-handling process will be executed and the corresponding error will be shown.
If there is no error, the dialog will close and proceed to the next step.
Step 5: Select the compiler
Please select a valid compiler from the quick dialog.

Note
Memory Configuration includes memory areas with name, address and length.
Example:
Memory Configuration:
Name   Origin          Length
-------------------------------
VEC    0x00000000      0x0004
ROM    0x000000d8      0x5d28
RAM    0x00ff700       0x0800
Device files should be placed under:
user\.vscode\extensions\<renesas-memory-usage-view>\device_filesCurrently supported devices: RX, RL78, RH850
5.1.2. Section tab
The “Section” tab is a core component of the Memory Usage View panel, designed to present a comprehensive table view of all memory sections parsed from either a .map or .elf file.
This table provides detailed metadata for each memory section, with the following columns:
Section: Name of the memory section (e.g.,
.text,.data,.bss, etc.).Start Address: The starting address of the section in memory.
End Address: The address of the last byte occupied by the section.
Size: The size of the section in bytes.
Align: Alignment requirement of the section (if available).
Attribute: Section attributes such as read/write/execute (if available).
Load Address: The load-time address for the section, used primarily in embedded systems.
Each row in the table corresponds to a specific memory section. Sections with a size of 0 or missing address fields (indicated by ---) may represent unused or reserved regions.
This layout offers an at-a-glance overview of memory allocation, helping developers and engineers quickly assess section sizes, memory usage, and layout across the address space.
To ensure consistency and clarity:
All data is automatically parsed from the selected input file.
Sections are displayed in the order they appear in the memory map.
Empty or unavailable values are denoted using dashes (
---) for better readability.
Example: Address Derivation from MAP File
The following illustrates how section addresses are extracted from a typical .map file:
SECTION                            START       END      SIZE   ALIGN    ATTRIBUTE
SU
                                00000004  00000103       100       4         DATA
SI
                                00000104  00000403       300       4         DATA
B_1
                                00000404  00000404         0       1         DATA
Converted result in the Section tab:
Section |
Start |
End |
Size |
Align |
Attribute |
|---|---|---|---|---|---|
SU |
0x00000004 |
0x00000103 |
256 |
4 |
DATA |
SI |
0x00000104 |
0x00000403 |
768 |
4 |
DATA |
B_1 |
0x00000404 |
|
0 |
1 |
DATA |
5.1.3. Sunburst tab
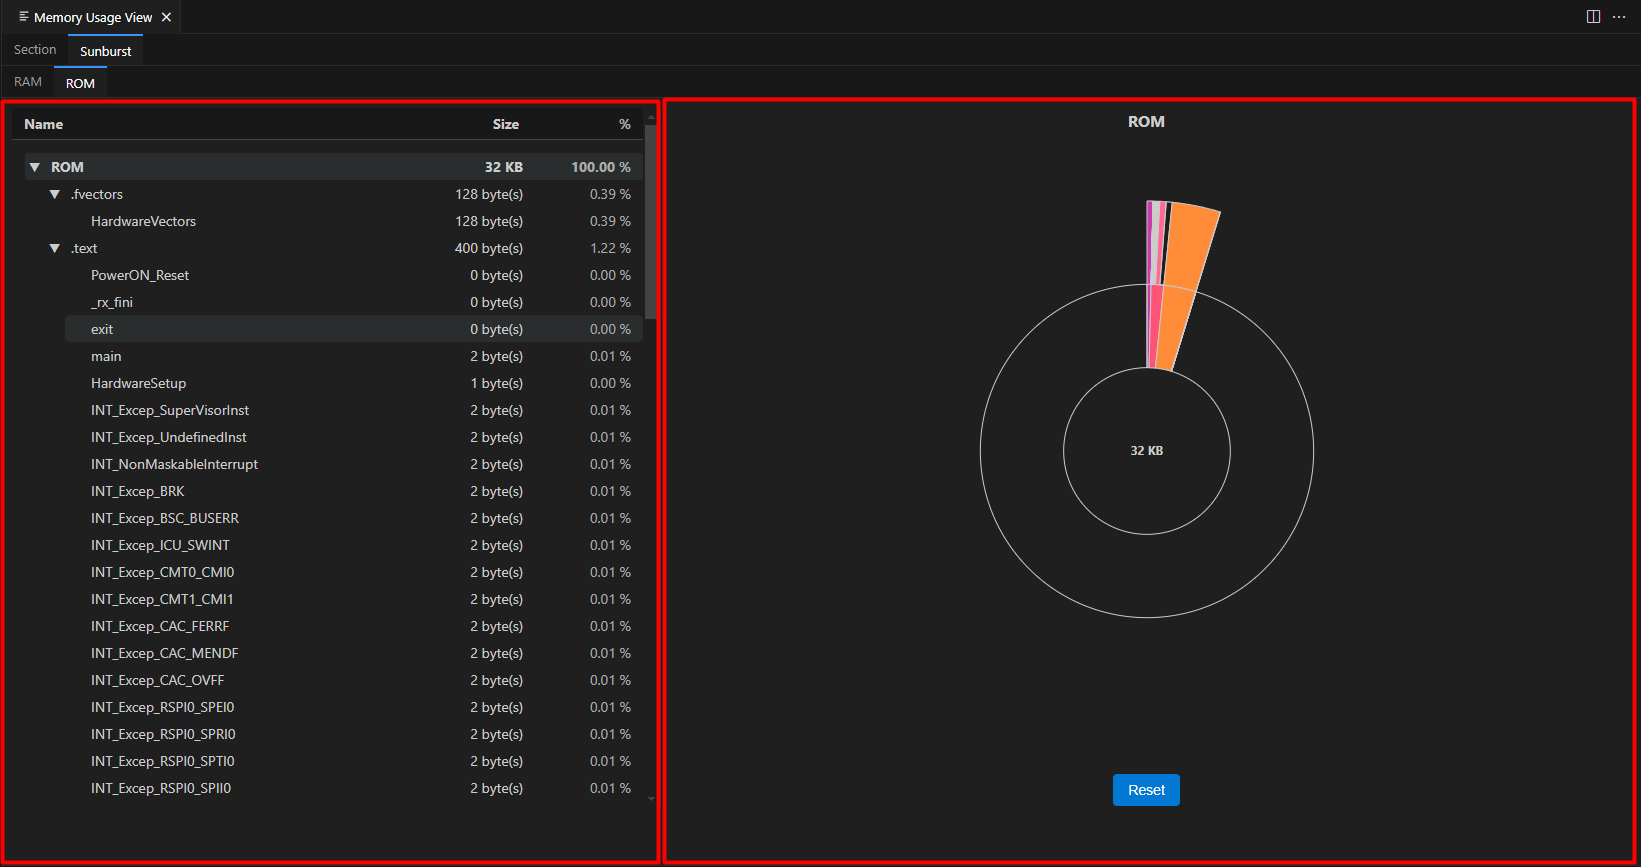
The “Sunburst” tab is a primary component of the Memory Usage View panel. When selected, it presents a dual-pane layout featuring a hierarchical memory tree alongside a corresponding sunburst chart.
Beneath the Sunburst tab, a set of sub-tabs represents various memory regions, such as RAM, ROM, FLASH, and others.
The active memory region is clearly highlighted with a blue top border and a distinct background colour, allowing users to easily identify the selected region.
To enhance user experience, all tabs support hover effects, providing immediate visual feedback when the cursor hovers over them.
5.1.3.1. Tree view
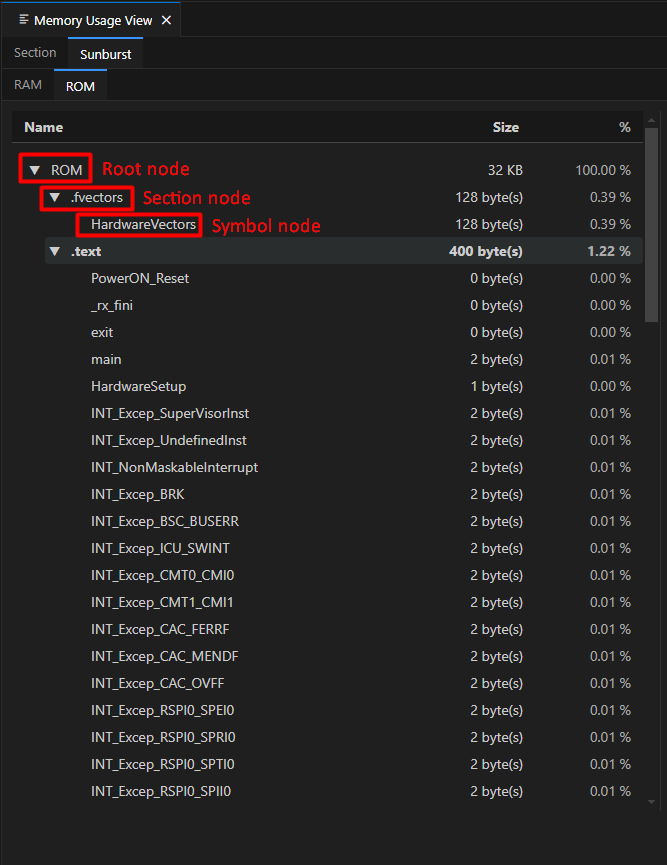
When a memory region (sub-tab) is selected, the memory tree appears on the left side of the interface. This tree follows a three-level hierarchical structure:
Root node: Represents the memory region (e.g., RAM, ROM, FLASH).
Section nodes: Children of the root node, representing memory sections (e.g., .data, .bss, .text).
Symbol nodes: Children of section nodes, representing individual symbols (e.g., main, exit).
Each node displays the following information:
Name
Memory size (in bytes). For the root node, the unit switches to KB if the size exceeds 1024 bytes.
Percentage of the total region size
Nodes that can be expanded or collapsed include an arrow icon (▼) to the left of the node label.
A special node labelled NONE-USAGE is included to represent unallocated or unused memory within the region.
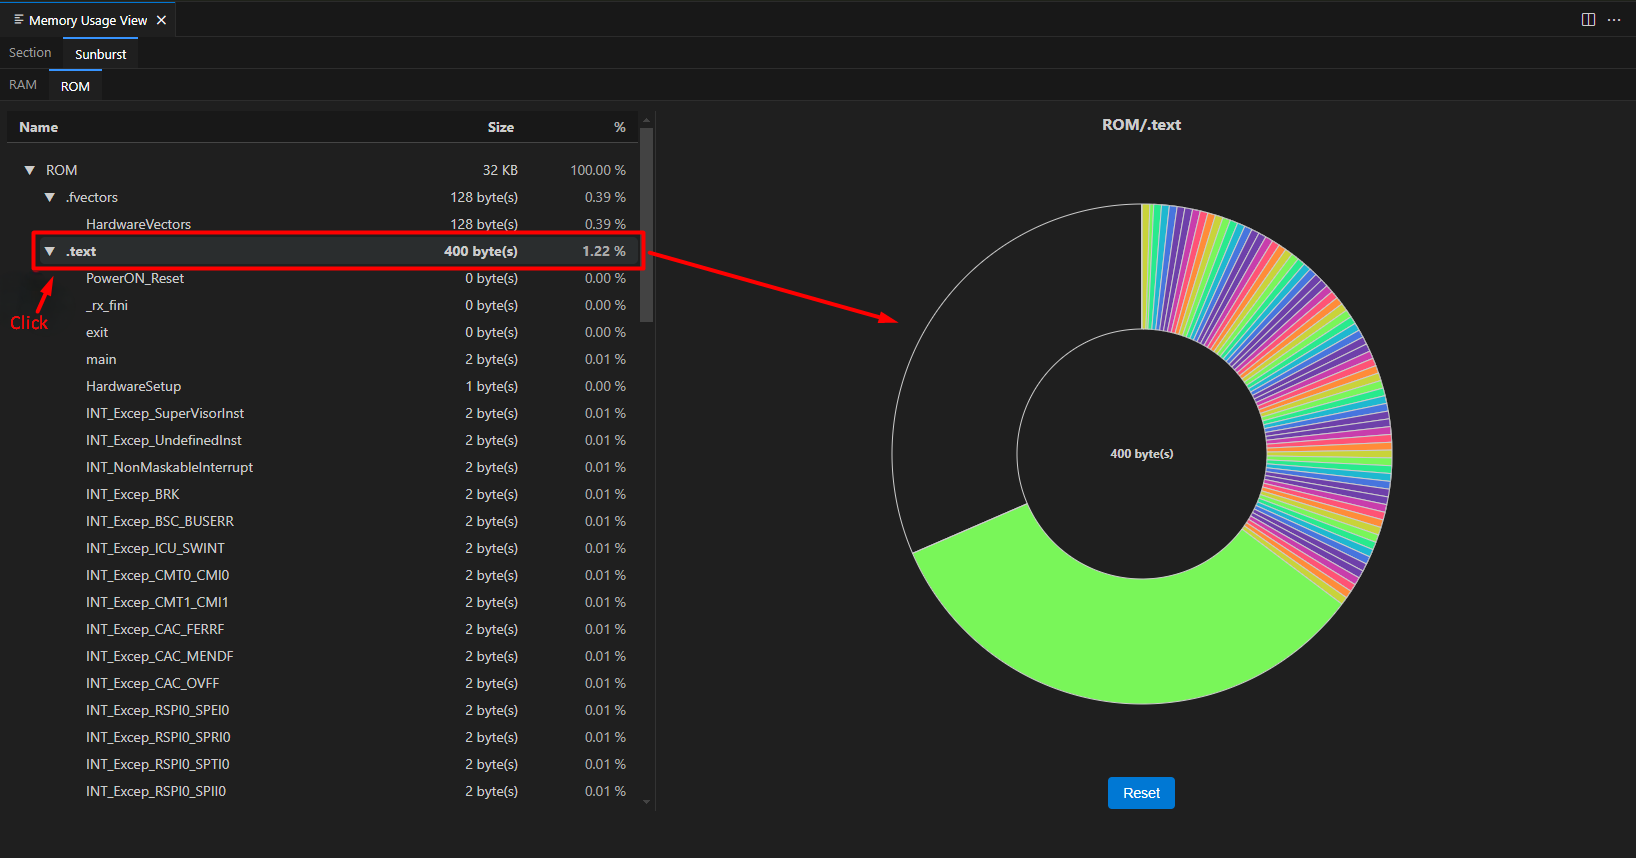
Interactive behaviour: Clicking on any node in the tree updates the sunburst chart to visually focus on the corresponding node and its hierarchy.
5.1.3.2. Sunburst chart
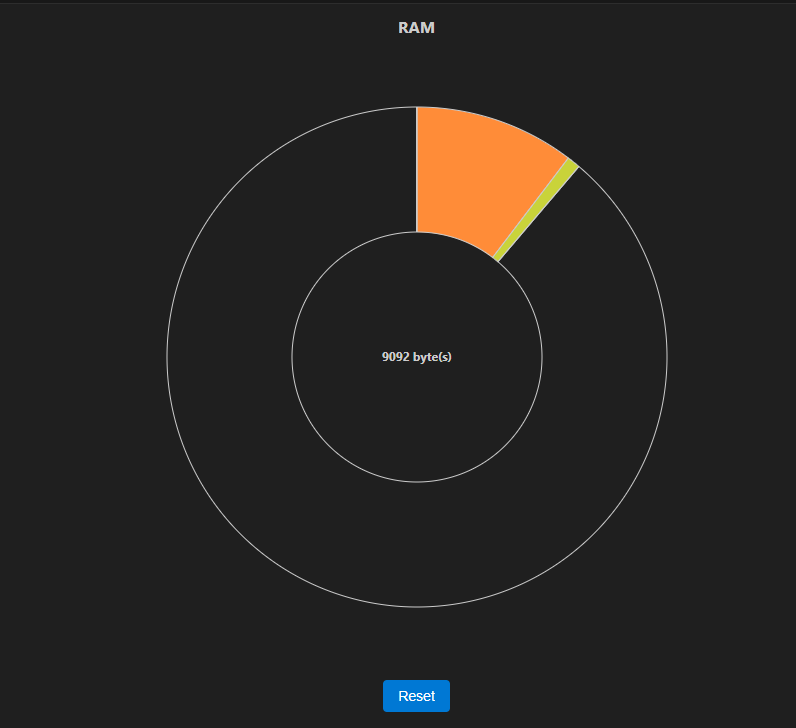
The sunburst chart is displayed on the right side of the interface, providing a visual representation of memory usage using concentric circles.
A label above the chart shows the currently selected node’s name (e.g., RAM, RAM/.bss).
At the centre of the chart, the size of the selected node is displayed in bytes. For the root node, the unit automatically switches to KB if the size exceeds 1024 bytes.
When hovering over a segment, the centre temporarily updates to display the size of the hovered segment, following the same rule.
Chart Structure
The innermost ring represents memory sections (e.g., .bss, .text).
The outer rings represent symbols within those sections.
Colour Scheme
Each section is assigned a unique base colour.
Symbols within a section inherit that base colour with varying brightness levels depending on their size:
Larger symbols appear darker.
Smaller symbols appear lighter.
The ‘NONE-USAGE’ area, representing unused or unallocated memory, is rendered in the same colour as the background.
Hover Effects:
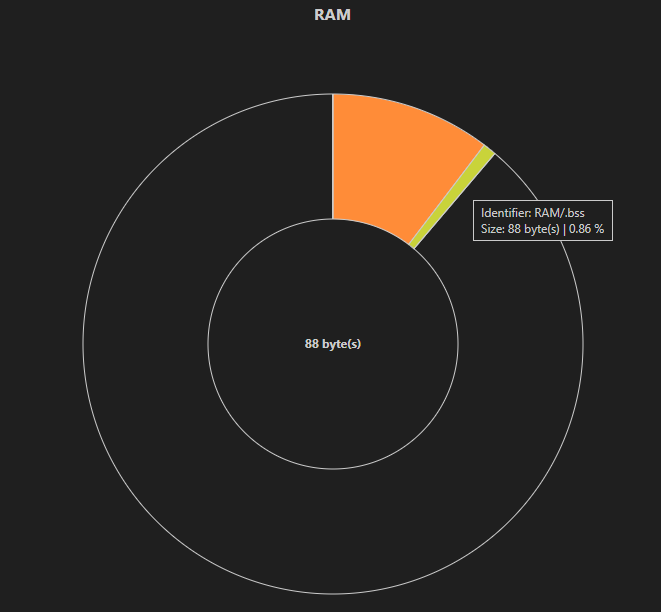
When the user hovers over a segment of the sunburst chart:
A tooltip appears, displaying the full identifier (e.g., RAM/.bss`) along with its exact size and percentage of the total region.
The centre label of the chart temporarily updates to show the hovered segment’s size.
Click Interaction:
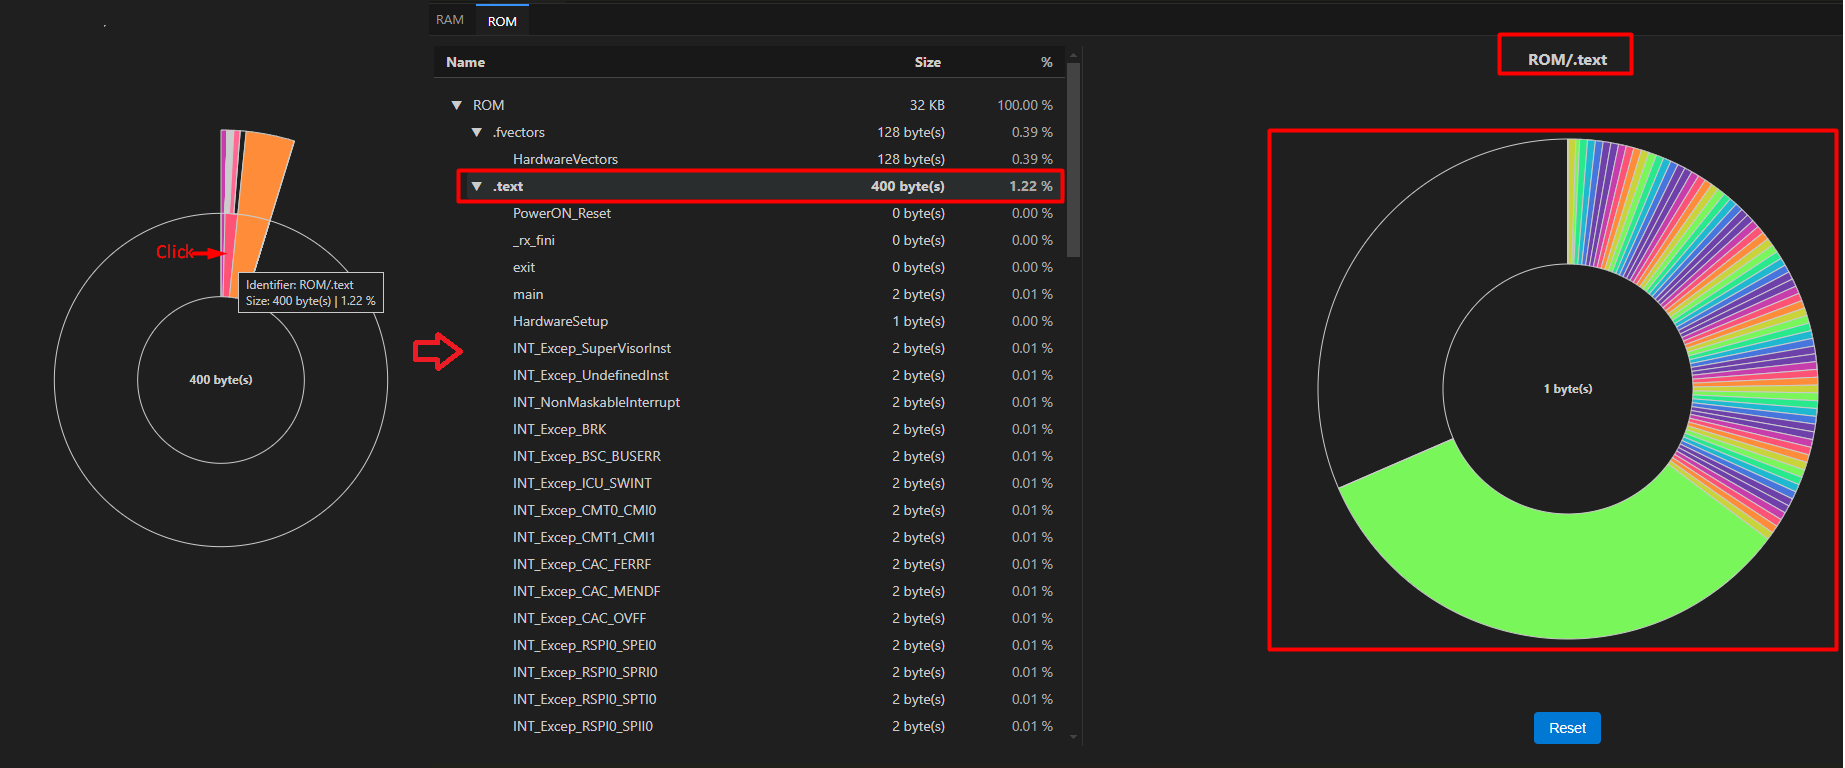
When the user clicks on a segment:
The chart drills down to focus on the clicked node, displaying only its children.
Both the label above the chart and the centre display are updated to reflect the name and size of the selected node.
If the clicked node has no children, the chart does not drill down further — only the label and centre display are updated.
Additionally:
The corresponding node in the memory tree view is highlighted to indicate selection.

